Fig. 3a
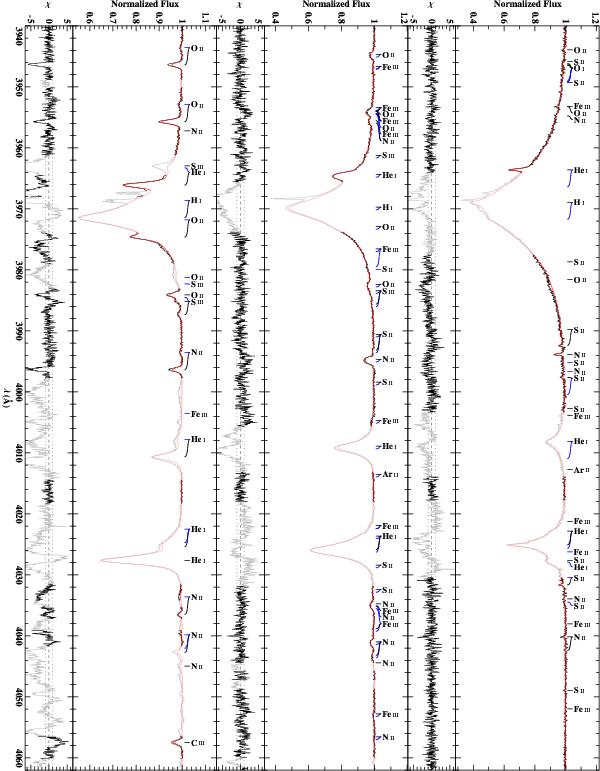
Comparison of best-fitting model spectrum (red line) with re-normalized observation (black line) for the objects, HD 119109 (right), HD 213420 (middle), and HD 75821 (left), in the spectral range λλ 3940–4062 Å. Light colors mark regions that have been excluded from the fitting due to the presence of features that are not (properly) included in our models. For the sake of clarity, only the strongest out of all lines that have been used in the analysis are labeled. Blue connection lines mark contributions of the secondary component. The residuals χ are defined by the bracket in Eq. (2).
Current usage metrics show cumulative count of Article Views (full-text article views including HTML views, PDF and ePub downloads, according to the available data) and Abstracts Views on Vision4Press platform.
Data correspond to usage on the plateform after 2015. The current usage metrics is available 48-96 hours after online publication and is updated daily on week days.
Initial download of the metrics may take a while.