Fig. 1
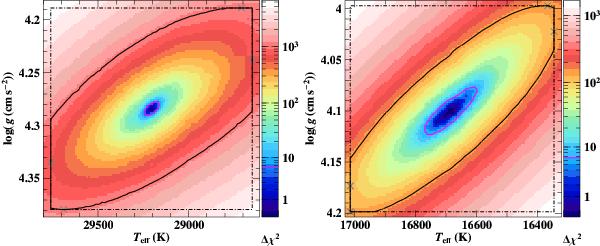
Examples of a color coded Δχ2 map as a function of effective temperature and surface gravity for the single star HD 37042 (left) and for the primary component of the SB2 system HD 119109 (right). The magenta line is the Δχ2 = 6.63 contour line, therefore, indicating the statistical (single parameter) 99%-confidence interval for abscissa and ordinate. The four corners of the black dashed-dotted rectangle are defined by the four combinations that result from adding or subtracting the respective total uncertainty, which is a quadratic sum of statistical and systematic uncertainty, to each coordinate of the best fit location. The point of minimum Δχ2 on each edge of the rectangle is marked by a gray cross. The solid black line surrounds the region within the rectangle with Δχ2 values lower or equal the maximum of the four Δχ2 values given by the gray crosses. In this way, areas within the rectangle where the models fit the observation worst are excluded, while it is ensured that each edge of the rectangle contributes at least one point to the solid line at the same time. This construction is our approach to combine statistical and systematic uncertainties.
Current usage metrics show cumulative count of Article Views (full-text article views including HTML views, PDF and ePub downloads, according to the available data) and Abstracts Views on Vision4Press platform.
Data correspond to usage on the plateform after 2015. The current usage metrics is available 48-96 hours after online publication and is updated daily on week days.
Initial download of the metrics may take a while.