Fig. 3
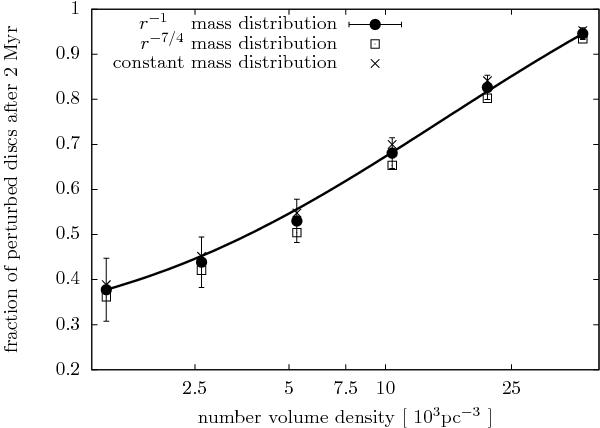
Fraction of stars with perturbed discs after 2 Myr of evolution as a function of the stellar number volume density in the central cluster region (rcentre = 0.3 pc). Circles represent the results of an initial r-1 disc-mass distribution, while crosses show the constant and open squares the r−7/4 distributions. The line represents a smooth Bezier fit to the data points for the r-1 distribution. The error bars indicate the standard deviation for p = 1, which is of the same order for the other distributions.
Current usage metrics show cumulative count of Article Views (full-text article views including HTML views, PDF and ePub downloads, according to the available data) and Abstracts Views on Vision4Press platform.
Data correspond to usage on the plateform after 2015. The current usage metrics is available 48-96 hours after online publication and is updated daily on week days.
Initial download of the metrics may take a while.