Fig. 6
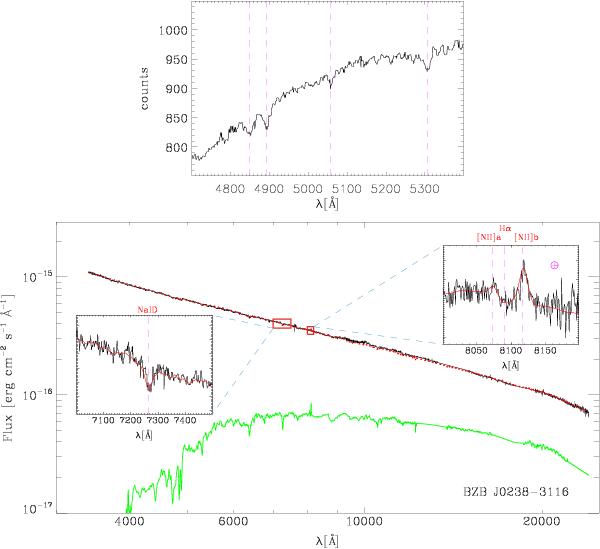
Top: part of the X-shooter counts spectrum of BZB J0238–3116 in the UVB arm after a median filtering with a 5-pixel window. The absorption features are identified as corresponding to the Ca II H&K, Hδ, and Ca I G absorption lines for z = 0.2328. The expected positions are indicated by the dashed vertical lines. Bottom: UV-to-NIR spectrum of BZB J0238–3116 obtained with X-shooter after flux calibration and telluric corrections (in black) along with the results of our modelling (in red). In the insets, zooms are on the absorption and emission lines (Na I D, [NII] λ 6583 Å and Hα) identified after flux calibration and telluric correction along with a local fit (in red). In green, the galaxy model, as composed by the template of Mannucci et al. (2001) with added emission lines of fixed width. The galaxy model normalisation and the slope of the model (in red) are the result of a fit, as explained in Sect. 3. Results are given in Table 8.
Current usage metrics show cumulative count of Article Views (full-text article views including HTML views, PDF and ePub downloads, according to the available data) and Abstracts Views on Vision4Press platform.
Data correspond to usage on the plateform after 2015. The current usage metrics is available 48-96 hours after online publication and is updated daily on week days.
Initial download of the metrics may take a while.