Fig. 5
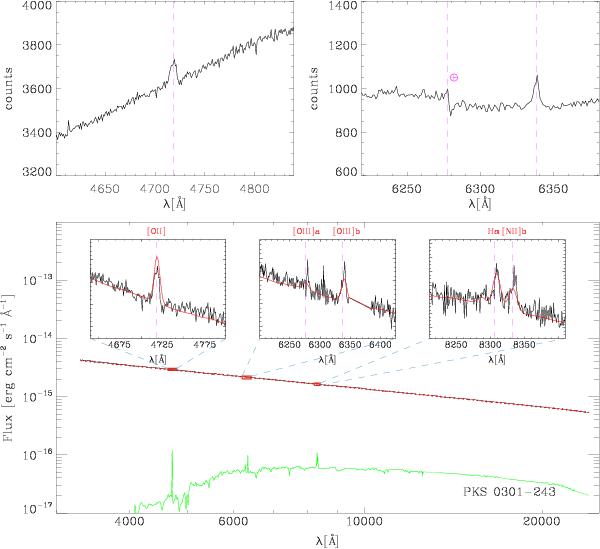
Top: parts of the PKS 0301–243 counts spectrum showing emission lines in the UVB (left) and VIS (right) arms. For the VIS only the Positive spectrum (see text) is shown, because the line has a better signal-to-noise and because the Central and Negative spectra are affected by bad pixels above 6350 Å. As shown by the vertical dashed lines, they correspond to [OII] λ 3727 Å and [OIII] λ 5007 Å emission lines when redshifted to z = 0.2657. The [OIII] λ 4959 Å emission line, expected at 6278 Å is not visible before correction of the telluric absorption. Bottom: UV-to-NIR spectrum of PKS 0301–243 obtained with X-shooter after flux calibration and telluric corrections (in black) along with the results of our modelling (in red). In the insets, zooms of the emission lines in the X-shooter spectrum along with a local fit (in red). In green the galaxy model, composed by the template of Mannucci et al. (2001) with added emission lines of fixed width. The template is scaled according to the measured R magnitude (Falomo & Ulrich 2000) and to the flux enclosed in the slit, while the emission lines are scaled to the X-shooter flux level (see text for details). Results are given in Tables 5 and 8.
Current usage metrics show cumulative count of Article Views (full-text article views including HTML views, PDF and ePub downloads, according to the available data) and Abstracts Views on Vision4Press platform.
Data correspond to usage on the plateform after 2015. The current usage metrics is available 48-96 hours after online publication and is updated daily on week days.
Initial download of the metrics may take a while.