Fig. 3
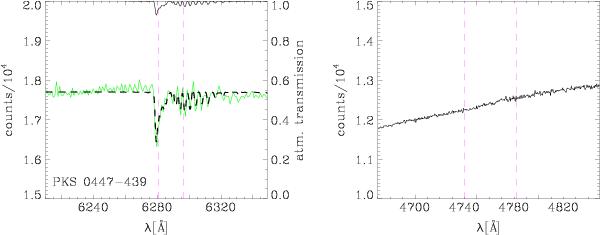
Left: PKS 0447–439 counts spectrum (continuous green line in the middle) in the region where Landt (2012) detects a feature that she interprets as the redshifted Mg II 2800 Å doublet (at a position shown by dashed vertical lines). The expected transmission rate, smeared to the resolution of our data, is shown in the top. Once normalised to the flux level of the PKS 0447–439 we show that the expected transmission rate (dashed curve) explains the shape of the PKS 0447–439 counts spectrum. Right: PKS 0447–439 counts spectrum in the region where Perlman (1998) detected the feature associated to the Ca II H&K doublet. The position expected for the Ca II H&K doublet at z = 0.205 is indicated by the vertical dashed lines.
Current usage metrics show cumulative count of Article Views (full-text article views including HTML views, PDF and ePub downloads, according to the available data) and Abstracts Views on Vision4Press platform.
Data correspond to usage on the plateform after 2015. The current usage metrics is available 48-96 hours after online publication and is updated daily on week days.
Initial download of the metrics may take a while.