Fig. 10
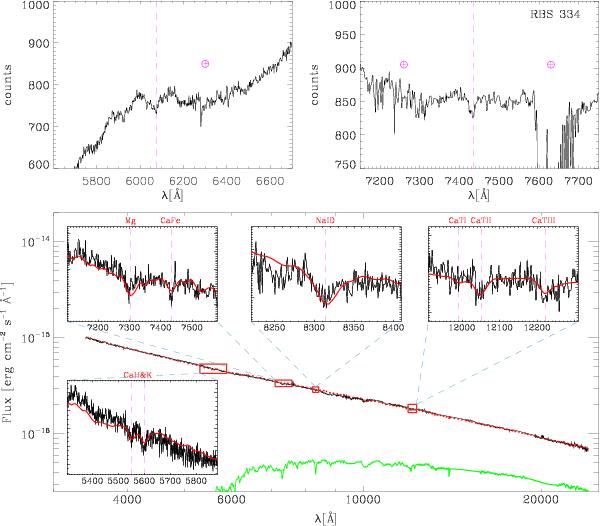
Top: part of the X-shooter counts spectrum of RBS 334 in the VIS arm after a median filtering with a 3-pixel window. The absorption features are identified as corresponding to the Ca I G (left) and CaI+FeI (right) lines for z = 0.411. The expected positions are indicated by the dashed vertical lines. Bottom: UV-to-NIR spectrum of RBS 334 (in black) along with the result of our modelling (in red) based on a fit of a galaxy template (in green) and a power law (see Sect. 3 for details and Table 8 for results). In the insets, zooms in regions where different absorption features were identified at z = 0.411 after flux calibration and telluric correction, which corresponds to Ca II H&K, Mg, CaI+FeI, Na I D, and the two stronger absorption lines of the calcium triplet.
Current usage metrics show cumulative count of Article Views (full-text article views including HTML views, PDF and ePub downloads, according to the available data) and Abstracts Views on Vision4Press platform.
Data correspond to usage on the plateform after 2015. The current usage metrics is available 48-96 hours after online publication and is updated daily on week days.
Initial download of the metrics may take a while.