Fig. 5
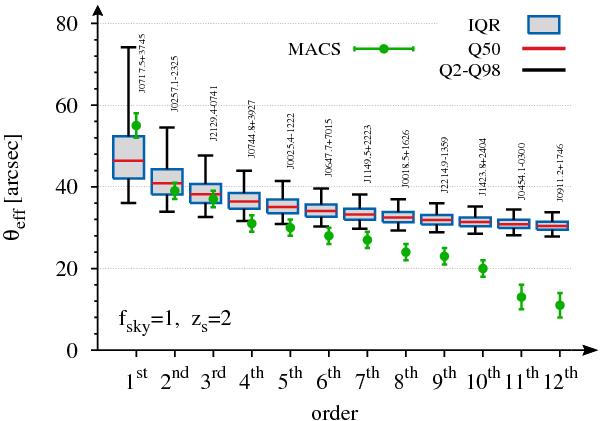
Box-and-whisker diagram for the comparison of the order statistics with the twelve observed effective Einstein radii of the MACS cluster sample Zitrin et al. (2011) as listed in . For each order, the red lines denote the median (Q50), the blue bordered grey boxes give the inner-quartile-range (IQR), and the black whiskers mark the range between the 2- and 98-percentiles (Q2, Q98) of the theoretical distribution. The green error bars represent the observed effective Einstein radius.
Current usage metrics show cumulative count of Article Views (full-text article views including HTML views, PDF and ePub downloads, according to the available data) and Abstracts Views on Vision4Press platform.
Data correspond to usage on the plateform after 2015. The current usage metrics is available 48-96 hours after online publication and is updated daily on week days.
Initial download of the metrics may take a while.