Fig. 4
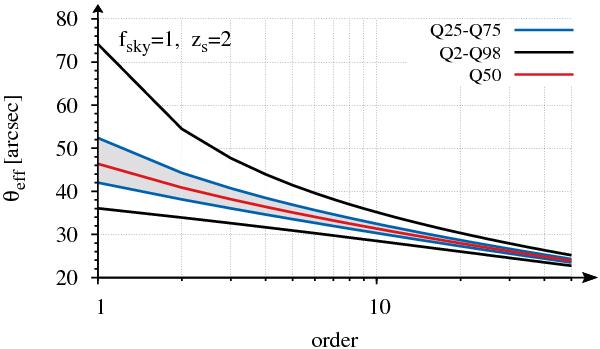
Dependence of different percentiles of the effective Einstein radius on the order assuming full sky coverage and a source redshift of zs = 2. The red line depicts the median (Q50), the blue lines the inner quartile range (Q25–Q75), and the black lines the 2-percentile (Q2, lower curve) and the 98-percentile (Q98, upper curve). The latter can be used as ΛCDM exclusion criterion given the assumptions.
Current usage metrics show cumulative count of Article Views (full-text article views including HTML views, PDF and ePub downloads, according to the available data) and Abstracts Views on Vision4Press platform.
Data correspond to usage on the plateform after 2015. The current usage metrics is available 48-96 hours after online publication and is updated daily on week days.
Initial download of the metrics may take a while.