Fig. 3
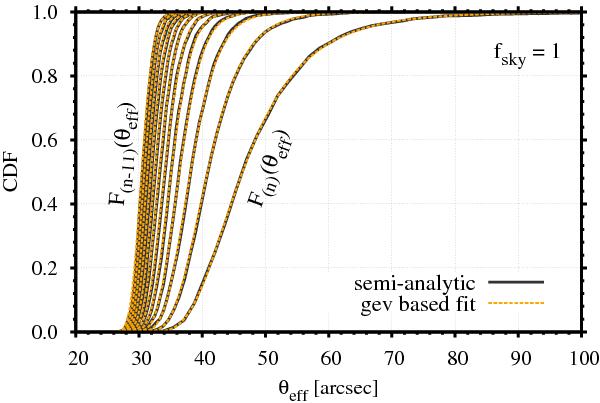
Cumulative distribution functions of the first twelve order statistics of the effective Einstein radius. The solid black lines depict the distributions based on the semi-analytic MC sampling of 2 000 Einstein radii in the redshift range of 0.5 ≤ z ≤ 1.0 on the full sky. The dashed orange lines denote fits of the distributions of the maxima F(n)(θeff) with a GEV distribution.
Current usage metrics show cumulative count of Article Views (full-text article views including HTML views, PDF and ePub downloads, according to the available data) and Abstracts Views on Vision4Press platform.
Data correspond to usage on the plateform after 2015. The current usage metrics is available 48-96 hours after online publication and is updated daily on week days.
Initial download of the metrics may take a while.