Fig. 2
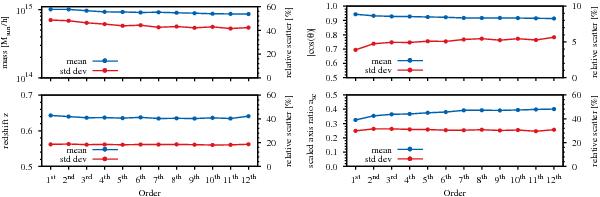
Dependence of the sample mean (blue lines) and relative scatter (red lines) on the chosen order for the halo mass (upper left-hand panel), the redshift (lower left-hand panel), the alignment | cos(θ)| (upper right-hand panel), and the scaled axis ratio, asc (lower right-hand panel). The red arrows denote constant shifts in the standard deviation in order to enhance the readability. The results are based on the samples presented in , comprising 2000 sampled values in the redshift range of 0.5 ≤ z ≤ 1.0 on the full sky.
Current usage metrics show cumulative count of Article Views (full-text article views including HTML views, PDF and ePub downloads, according to the available data) and Abstracts Views on Vision4Press platform.
Data correspond to usage on the plateform after 2015. The current usage metrics is available 48-96 hours after online publication and is updated daily on week days.
Initial download of the metrics may take a while.