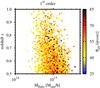
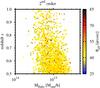
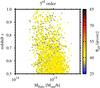
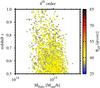
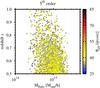
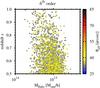
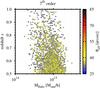
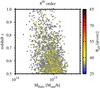
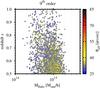
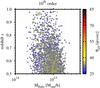
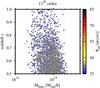
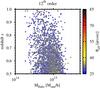
Fig. 1
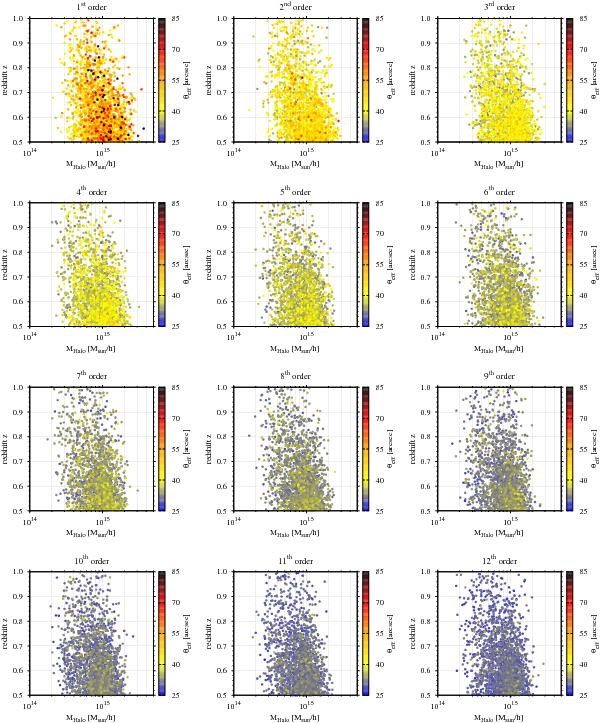
Distribution in mass and redshift of 2000 sampled values of the effective Einstein radius of the twelve largest orders as indicated above each panel. We assume the redshift interval of 0.5 ≤ z ≤ 1.0 on the full sky, the Tinker et al. (2008) mass function, and a source redshift of zs = 2.0. The colour encodes the size of the individual effective Einstein radii of a given order from each simulation run.
Current usage metrics show cumulative count of Article Views (full-text article views including HTML views, PDF and ePub downloads, according to the available data) and Abstracts Views on Vision4Press platform.
Data correspond to usage on the plateform after 2015. The current usage metrics is available 48-96 hours after online publication and is updated daily on week days.
Initial download of the metrics may take a while.