Fig. 7
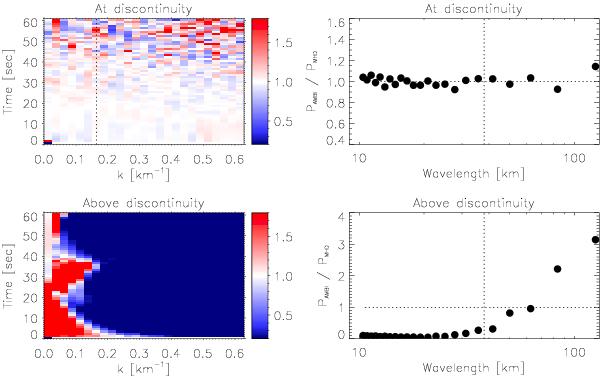
Fourier analysis of scales developed in the θ = 90° simulations. Panels on the left show the relative power in the AD simulation divided by the power in MHD simulation as a function of horizontal wave number along the discontinuity (k) and time. Red means that the AD simulation has more power. Panels on the right give the time average of the power ratio from the panels on the left.
Current usage metrics show cumulative count of Article Views (full-text article views including HTML views, PDF and ePub downloads, according to the available data) and Abstracts Views on Vision4Press platform.
Data correspond to usage on the plateform after 2015. The current usage metrics is available 48-96 hours after online publication and is updated daily on week days.
Initial download of the metrics may take a while.