Free Access
Fig. 5
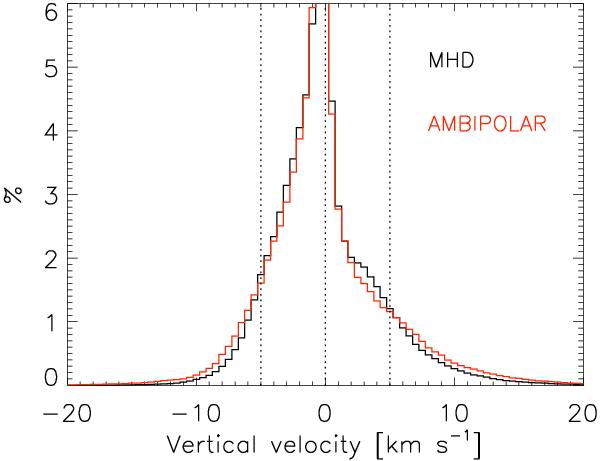
Velocity histograms over the whole simulation time for the θ = 90° MHD and AD runs. We note the asymmetry of the histogram and the slight tendency of the AD simulation to develop higher velocities.
Current usage metrics show cumulative count of Article Views (full-text article views including HTML views, PDF and ePub downloads, according to the available data) and Abstracts Views on Vision4Press platform.
Data correspond to usage on the plateform after 2015. The current usage metrics is available 48-96 hours after online publication and is updated daily on week days.
Initial download of the metrics may take a while.