Fig. 2
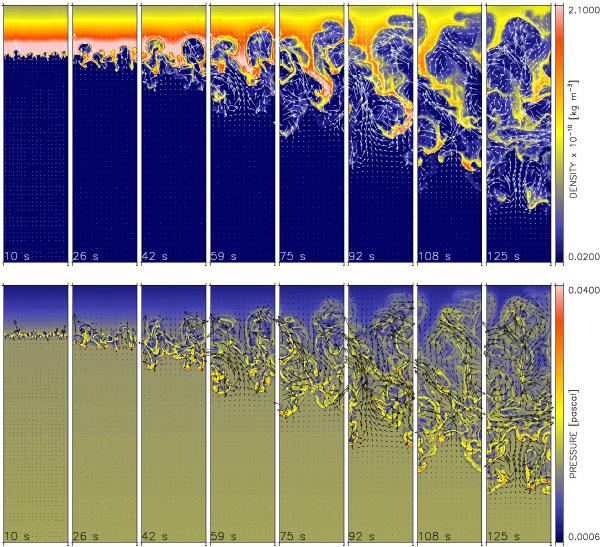
Time evolution of density (top) and pressure (bottom) in the AD simulation with θ = 90°. The size of each snapshot is 250 × 1000 km, the time elapsed is given at the bottom of each panel. The velocity field is indicated by arrows. We note the asymmetry between the large-scale rising bubbles and small-scale downflowing fingers in the density images.
Current usage metrics show cumulative count of Article Views (full-text article views including HTML views, PDF and ePub downloads, according to the available data) and Abstracts Views on Vision4Press platform.
Data correspond to usage on the plateform after 2015. The current usage metrics is available 48-96 hours after online publication and is updated daily on week days.
Initial download of the metrics may take a while.