Fig. 14
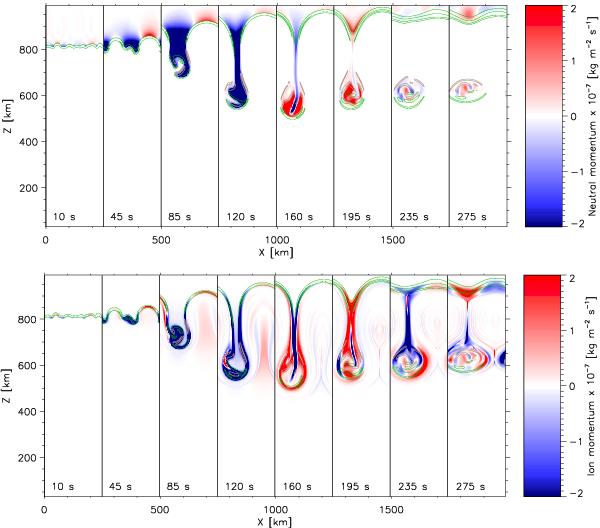
Top: time evolution of the vertical component of the neutral momentum from Eq. (14) in the θ = 89° AD run. Negative values mean downward motion. The contours of vertical drift momentum  and −10-9 kg m-2 s-1 (see Eq. (16)) are overplotted in green and gray, respectively. Bottom: the same for the ion momentum. The size of each snapshot is 250 × 1000 km; the time elapsed is given at the bottom of each panel, the color scheme is constant in time, and is the same in both panels.
Current usage metrics show cumulative count of Article Views (full-text article views including HTML views, PDF and ePub downloads, according to the available data) and Abstracts Views on Vision4Press platform.
Data correspond to usage on the plateform after 2015. The current usage metrics is available 48-96 hours after online publication and is updated daily on week days.
Initial download of the metrics may take a while.