Fig. 10
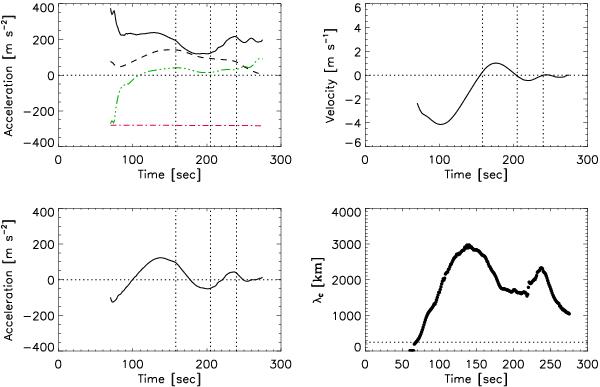
Top left: acceleration as a function of time due to the gravity force (dash-dotted red line), gas pressure gradient force (triple-dot-dashed green line), magnetic pressure gradient force (solid black line), and magnetic tension force (dashed black line). The values are integrated over the big drop from Fig. 8 (AD run) after it forms at about 70 s of the simulation time. Bottom left: acceleration due to the sum of all above forces. Top right: vertical velocity of the big drop. Vertical dotted lines indicate time instants of zero velocity. Bottom right: effective cutoff wavelength calculated from Eq. (1) for the horizontal field component Bcos(θ) at the bottom of the drop. Horizontal dotted lines indicate the size of the computational domain L = 250 km.
Current usage metrics show cumulative count of Article Views (full-text article views including HTML views, PDF and ePub downloads, according to the available data) and Abstracts Views on Vision4Press platform.
Data correspond to usage on the plateform after 2015. The current usage metrics is available 48-96 hours after online publication and is updated daily on week days.
Initial download of the metrics may take a while.