Free Access
Fig. 7
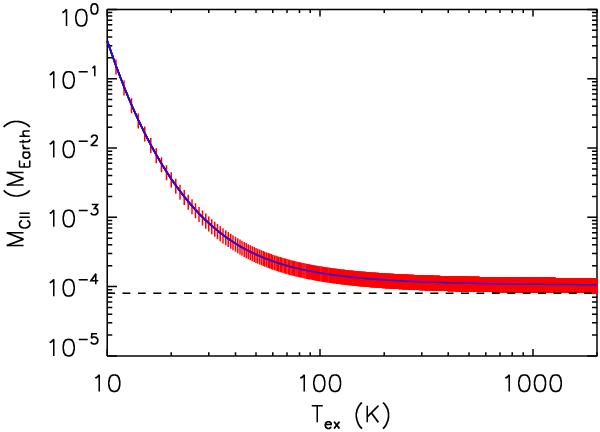
Gas mass versus excitation temperature for [CII] in HD 181296. The red, vertical bars show the error in the [CII] gas mass determination. The doted, horizontal bar depicts the position of the lower limit to the [CII] gas mass.
Current usage metrics show cumulative count of Article Views (full-text article views including HTML views, PDF and ePub downloads, according to the available data) and Abstracts Views on Vision4Press platform.
Data correspond to usage on the plateform after 2015. The current usage metrics is available 48-96 hours after online publication and is updated daily on week days.
Initial download of the metrics may take a while.