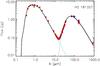
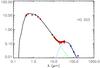
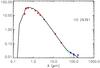
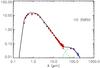
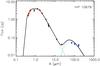
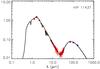
Fig. 5
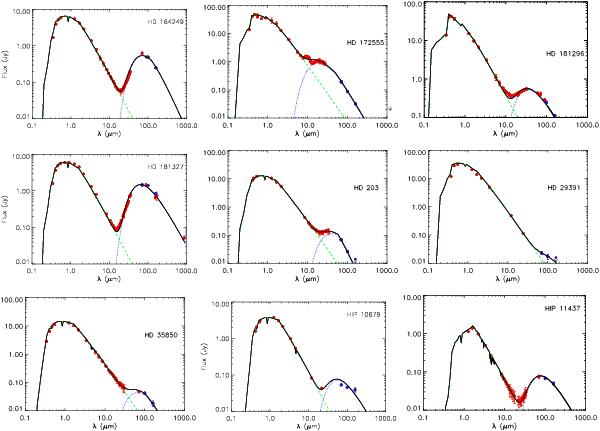
Blackbody models for BPMG members detected with PACS. Red dots are photometric points from the catalogues and literature (see Sect. 2). Blue dots are PACS observations from this work. The black solid line represents the photosphere plus blackbody model. The doted blue line represents the blackbody that better fits the dust. The green dashed line represents the photospheric contribution.
Current usage metrics show cumulative count of Article Views (full-text article views including HTML views, PDF and ePub downloads, according to the available data) and Abstracts Views on Vision4Press platform.
Data correspond to usage on the plateform after 2015. The current usage metrics is available 48-96 hours after online publication and is updated daily on week days.
Initial download of the metrics may take a while.