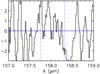
Fig. 4
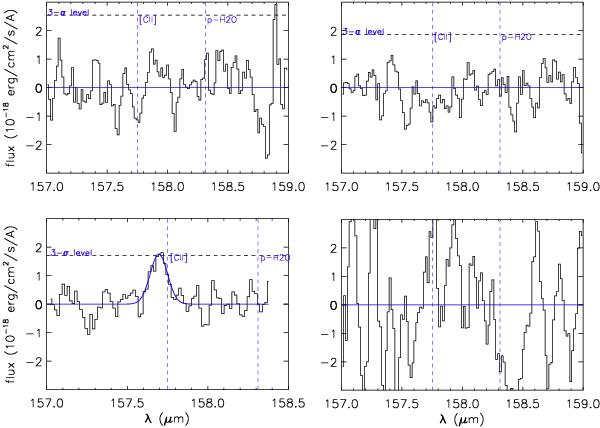
Continuum-subtracted spectra of BPMG members at 157 μm. The vertical blue dashed lines represent the position of the [OI] and o-H2O. From left to right and top to bottom, targets are HD 164249, HD 172555 (averaged and re-centred with respect to the rest frame wavelength), HD 181296, and HD 181327. We show 3σ limits as horizontal black dashed lines. For HD 181296 we show in blue a Gaussian fit to the data, while for the other sources the blue horizontal line depicts the position of the continuum. The noise in HD 181327 spectrum is more than two times greater than in the other spectra.
Current usage metrics show cumulative count of Article Views (full-text article views including HTML views, PDF and ePub downloads, according to the available data) and Abstracts Views on Vision4Press platform.
Data correspond to usage on the plateform after 2015. The current usage metrics is available 48-96 hours after online publication and is updated daily on week days.
Initial download of the metrics may take a while.