Fig. 1
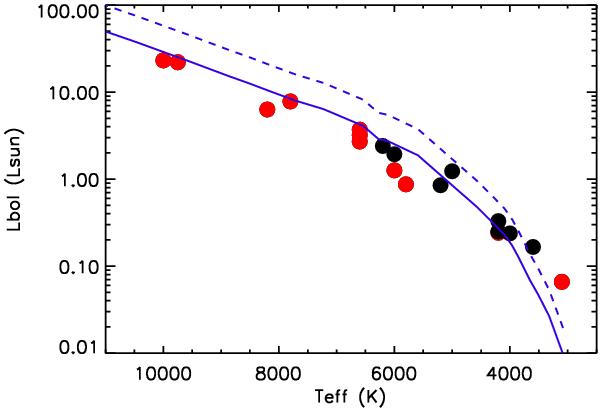
Hertzsprung-Russell diagram for BPMG members in the sample. The blue solid line represents the 20 Myr isochrone, while the blue dashed one represents a 20 Myr isochrone with 2 times larger luminosity to include unresolved binary systems. The isochrones come from the models by Siess et al. (2000). Red filled circles are objects detected by PACS while black filled circles are objects not detected in PACS photometry.
Current usage metrics show cumulative count of Article Views (full-text article views including HTML views, PDF and ePub downloads, according to the available data) and Abstracts Views on Vision4Press platform.
Data correspond to usage on the plateform after 2015. The current usage metrics is available 48-96 hours after online publication and is updated daily on week days.
Initial download of the metrics may take a while.