Fig. 2
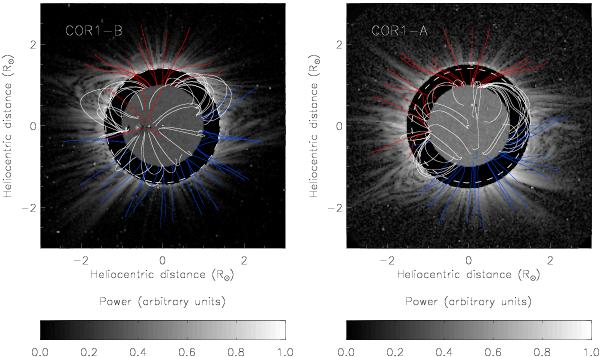
2D maps of the power of the plasma density fluctuations, over the 4−8 h periodicity band, derived in the fields of view of COR1-B (left panel) and COR1-A (right panel), on April 18, 2008 at 21:50 UT; the power of the fluctuating structures is significant with a 99% statistical confidence, for a white-noise process; the extrapolated magnetic field lines (white lines refer to closed field lines, red and blue lines to open field lines, with positive and negative polarity, respectively) and the SOHO/MDI disk magnetograms as seen from the STEREO-B and STEREO-A viewpoints on April 19, 2008 at 00:04 UT are also shown; the white dashed lines indicate the edge of the STEREO occulter.
Current usage metrics show cumulative count of Article Views (full-text article views including HTML views, PDF and ePub downloads, according to the available data) and Abstracts Views on Vision4Press platform.
Data correspond to usage on the plateform after 2015. The current usage metrics is available 48-96 hours after online publication and is updated daily on week days.
Initial download of the metrics may take a while.