Fig. 3
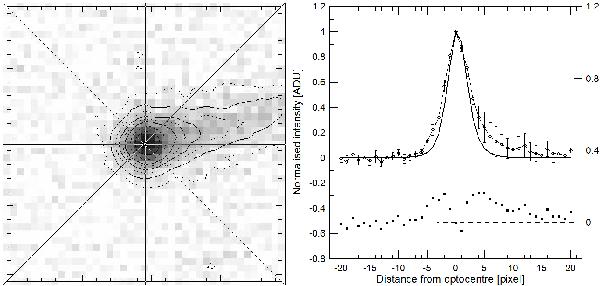
Left: extraction of profiles, superimposed on the “master image” obtained for the R filter (innermost 40 × 40 pixels; N is up, E is left), together with contour plots; right: comparison of the averaged profile (thin continuous line; error bars on points are due to dispersion of values) with the average stellar PSF profile (thick continuous line), together with the residual points (subtraction of the stellar profile to the target profile; black filled dots).
Current usage metrics show cumulative count of Article Views (full-text article views including HTML views, PDF and ePub downloads, according to the available data) and Abstracts Views on Vision4Press platform.
Data correspond to usage on the plateform after 2015. The current usage metrics is available 48-96 hours after online publication and is updated daily on week days.
Initial download of the metrics may take a while.