Fig. 7
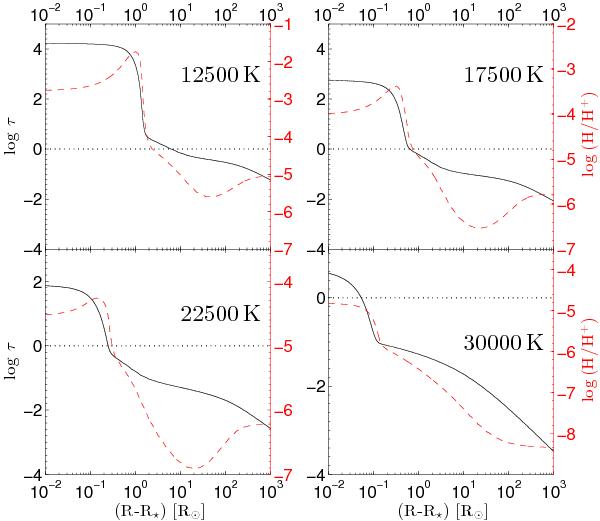
Comparison between the H ionisation structure (red dashed line) and the Lyman continuum optical depth at λ ~ 900 Å (black solid line) versus the distance from the stellar photosphere. Solid lines are reserved for the wind optical depth, whilst the dotted horizontal lines indicate the transition between optically thick and thin part of the wind in the Lyman continuum (τ = 1). Red colour on the right-hand side is used for the H ionisation structure.
Current usage metrics show cumulative count of Article Views (full-text article views including HTML views, PDF and ePub downloads, according to the available data) and Abstracts Views on Vision4Press platform.
Data correspond to usage on the plateform after 2015. The current usage metrics is available 48-96 hours after online publication and is updated daily on week days.
Initial download of the metrics may take a while.