Fig. A.1
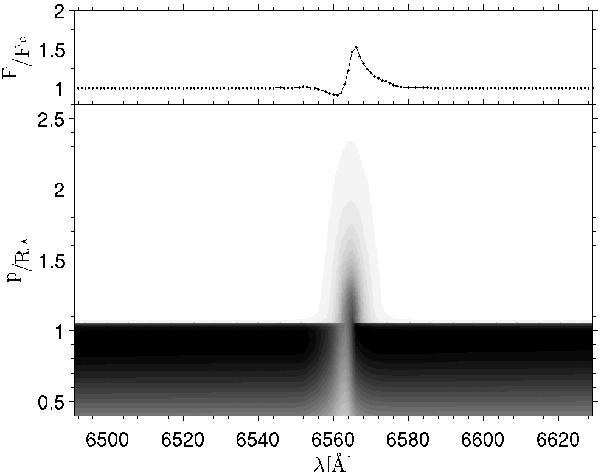
Model C (Teff = 12 500 K). Bottom: grey scale plot of the flux like quantity p × I(p) as a function of impact parameter p/R⋆, where R⋆ is hydrostatic radius. The figure provides the distribution of the emergent intensity around Hα from different p. Top: corresponding normalised flux in Hα, directly obtained by integrating p × I(p) over the range of p.
Current usage metrics show cumulative count of Article Views (full-text article views including HTML views, PDF and ePub downloads, according to the available data) and Abstracts Views on Vision4Press platform.
Data correspond to usage on the plateform after 2015. The current usage metrics is available 48-96 hours after online publication and is updated daily on week days.
Initial download of the metrics may take a while.