Fig. 12
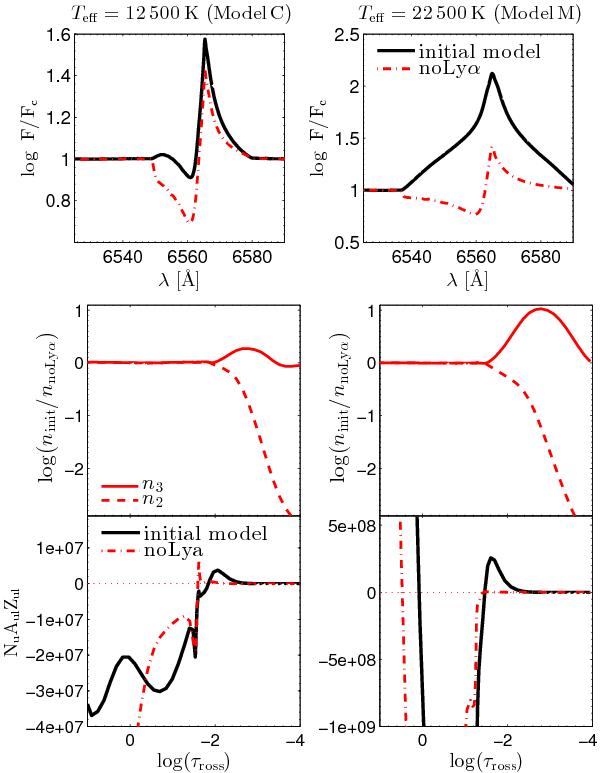
Upper panels: effect of Lyα on the formation of the Hα line: initial Hα profile (black solid) and the profile from the models in which Lyα transitions were artificially removed (the red dash-dotted line). Middle panels: changes in the 2nd (dashed) and 3rd (solid) level of H due to the removal of Lyα in model C (left) and M (right). The plots present the ratio of the populations produced from the initial model over the populations from the models without Lyα transition. Lower panels: comparison of the net radiative rate of 2→1 transitions in the initial (solid black) and the model without Lyα (the red dash-dotted line) (see Sect. 3.4 for details).
Current usage metrics show cumulative count of Article Views (full-text article views including HTML views, PDF and ePub downloads, according to the available data) and Abstracts Views on Vision4Press platform.
Data correspond to usage on the plateform after 2015. The current usage metrics is available 48-96 hours after online publication and is updated daily on week days.
Initial download of the metrics may take a while.