Fig. 1
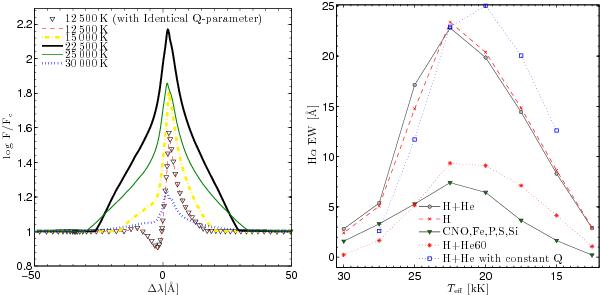
Left: Hα line profiles for cmfgen models with parameters as listed in Table 1. Black triangles represent the line profile with the same Q-parameter (Eq. (1)) as model C (Teff = 12 500 K), but with different Ṁ and R⋆ values. Right: Hα line EW vs. Teff for models with only H (crosses), H+He (circles), and more sophisticated (triangles) models. Red asterisks represent the changes in the Hα line when the He mass fraction in the pure H+He models is increased to 60%. Blue squares indicate how the Hα EW behaves as a function of a constant Q value.
Current usage metrics show cumulative count of Article Views (full-text article views including HTML views, PDF and ePub downloads, according to the available data) and Abstracts Views on Vision4Press platform.
Data correspond to usage on the plateform after 2015. The current usage metrics is available 48-96 hours after online publication and is updated daily on week days.
Initial download of the metrics may take a while.