Fig. 9
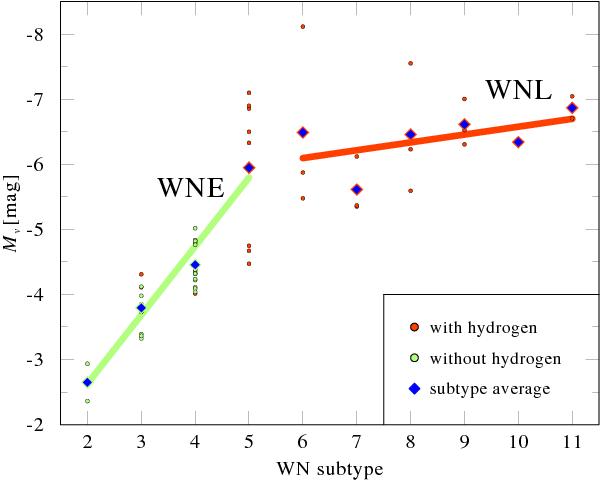
Absolute visual magnitudes (narrowband color as defined by Smith 1968) versus spectral subtype number for the putatively single stars in our sample. Colors code the absence (green/light) or presence (red/dark) of hydrogen. While small symbols represent individual stars, the thick symbols mark the average Mv of each subtype. The thick lines indicate linear fits to the early (WN2–5) and late (WN6–11) subtypes, respectively.
Current usage metrics show cumulative count of Article Views (full-text article views including HTML views, PDF and ePub downloads, according to the available data) and Abstracts Views on Vision4Press platform.
Data correspond to usage on the plateform after 2015. The current usage metrics is available 48-96 hours after online publication and is updated daily on week days.
Initial download of the metrics may take a while.