Fig. 5
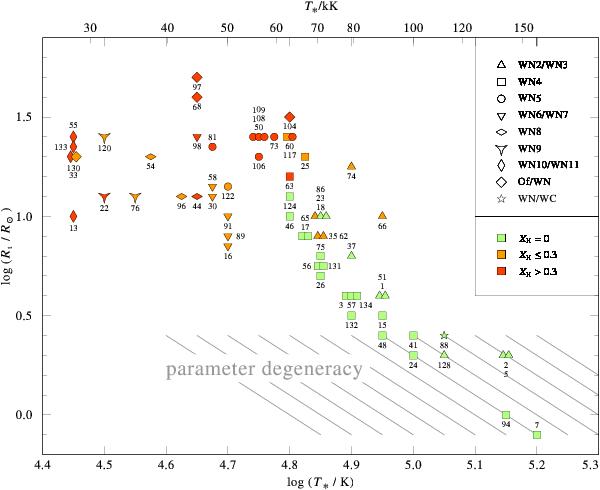
Positions of the analyzed WN stars in the log T∗-log Rt-plane. The labels refer to the BAT99 catalog. Different WN subtypes are distinguished by the shape of the symbols, as shown in the inlet. The hydrogen abundance is color-coded in three steps (undetectable, about 0.2, and about 0.4 mass fraction). The lower hatched part roughly indicates the region where the parameter space becomes degenerate because of large optical thickness of the wind. In this part, the stars can be shifted parallel to the gray lines without significant changes in the synthetic normalized emission line spectrum.
Current usage metrics show cumulative count of Article Views (full-text article views including HTML views, PDF and ePub downloads, according to the available data) and Abstracts Views on Vision4Press platform.
Data correspond to usage on the plateform after 2015. The current usage metrics is available 48-96 hours after online publication and is updated daily on week days.
Initial download of the metrics may take a while.