Free Access
Fig. 1
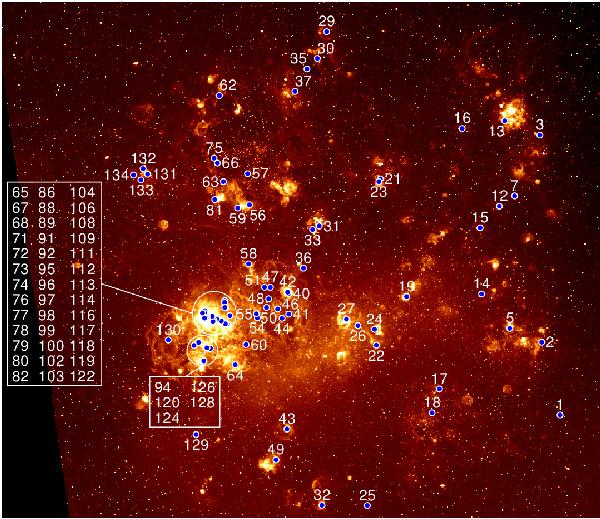
WN stars of our sample, identified by their number in the BAT99 catalog. The two boxes refer to the very crowded region of 30 Doradus. The Hα image in the background is from the Magellanic Cloud Emission-Line Survey (MCELS, Smith et al. 2005).
Current usage metrics show cumulative count of Article Views (full-text article views including HTML views, PDF and ePub downloads, according to the available data) and Abstracts Views on Vision4Press platform.
Data correspond to usage on the plateform after 2015. The current usage metrics is available 48-96 hours after online publication and is updated daily on week days.
Initial download of the metrics may take a while.