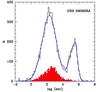
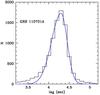
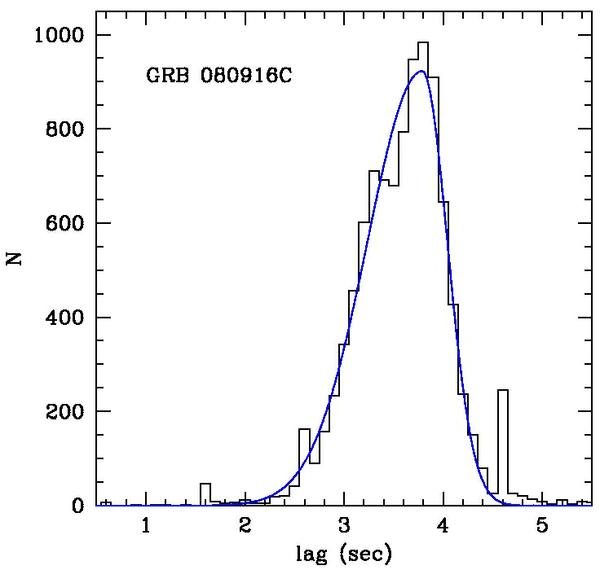
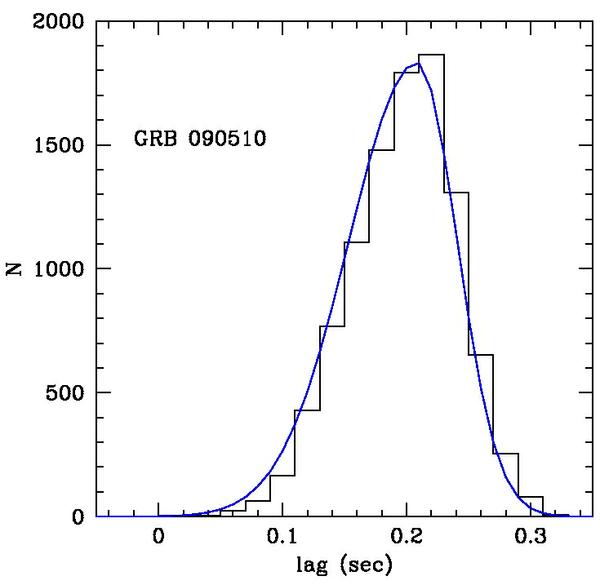
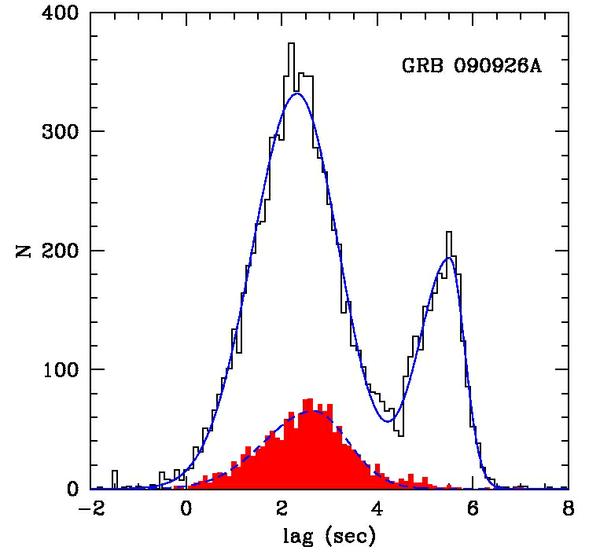
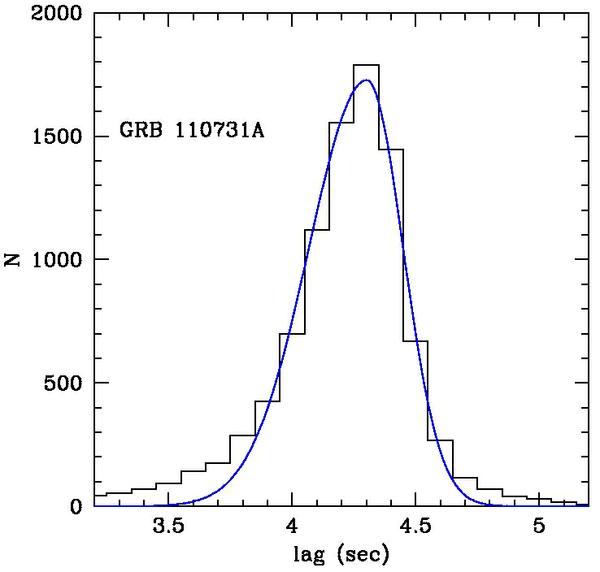
Fig. 3
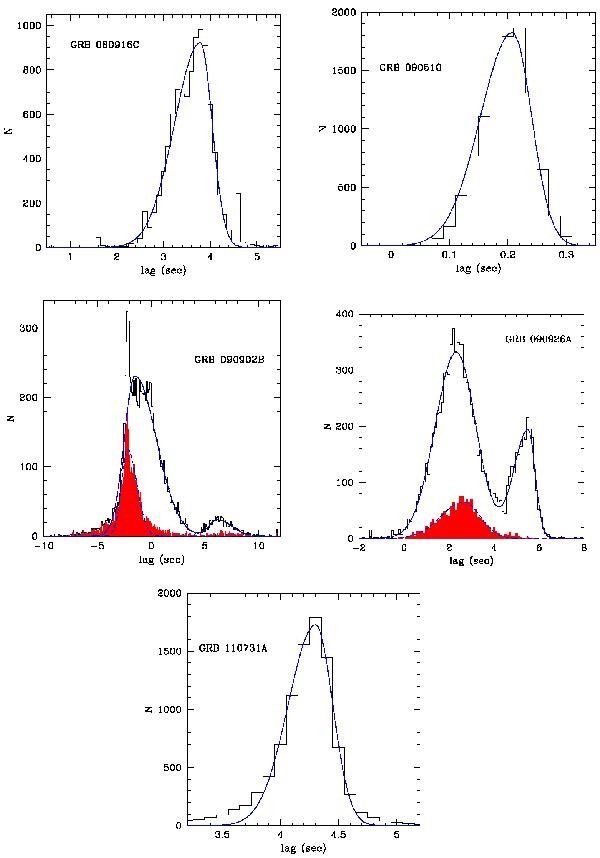
Time lag distributions (black histograms) obtained by cross-correlating the simulated GBM and LAT light curves. Positive time lags correspond to the LAT signal lagging the GBM signal. The asymmetric Gaussian fit is reported as a blue solid line. The red areas correspond to the distributions of time lags obtained considering those fits that are significant at a 4σ level or higher, according to the χ2 statistics (i.e., fits with χ2/ d.o.f. ≳3 are rejected). The asymmetric Gaussian fit for the red areas is reported as a blue dashed line.
Current usage metrics show cumulative count of Article Views (full-text article views including HTML views, PDF and ePub downloads, according to the available data) and Abstracts Views on Vision4Press platform.
Data correspond to usage on the plateform after 2015. The current usage metrics is available 48-96 hours after online publication and is updated daily on week days.
Initial download of the metrics may take a while.