Free Access
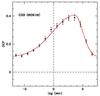
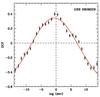
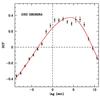
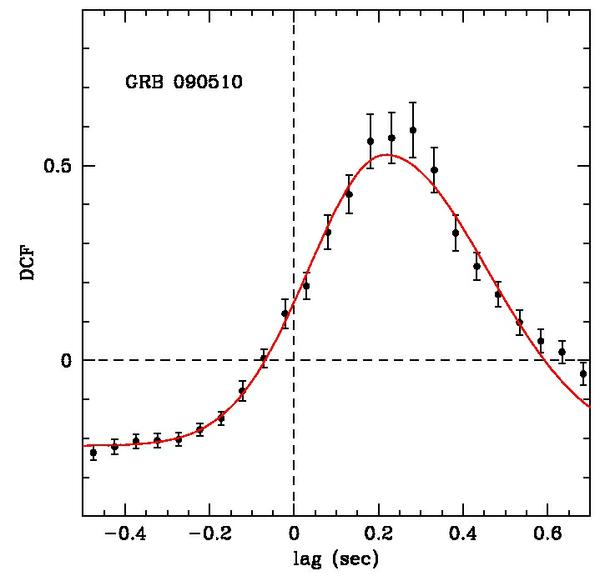
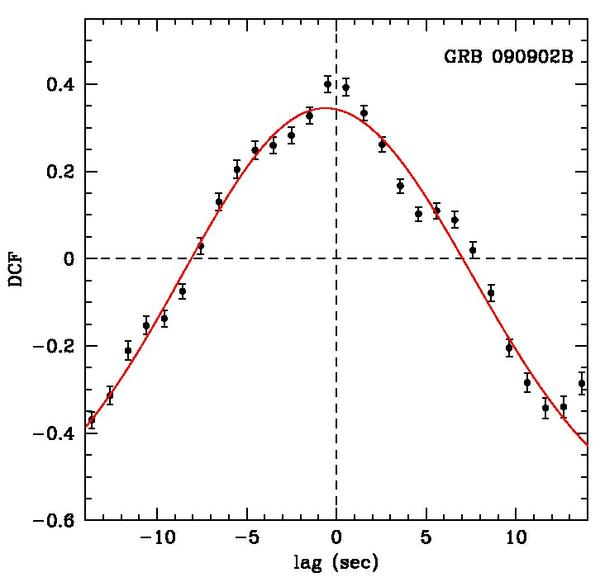
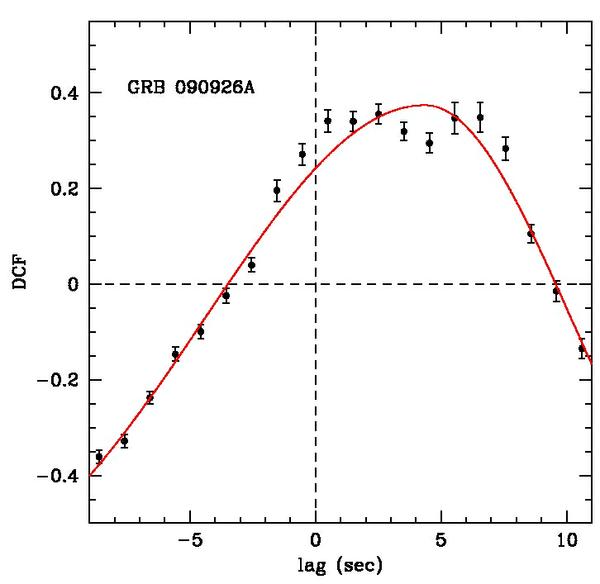
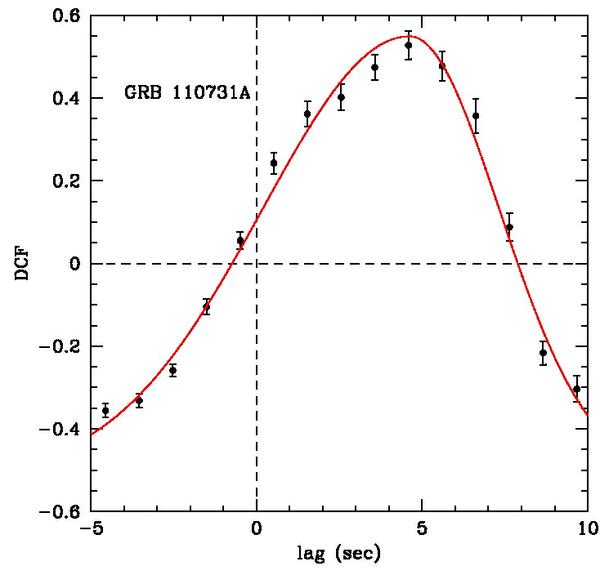
Fig. 2
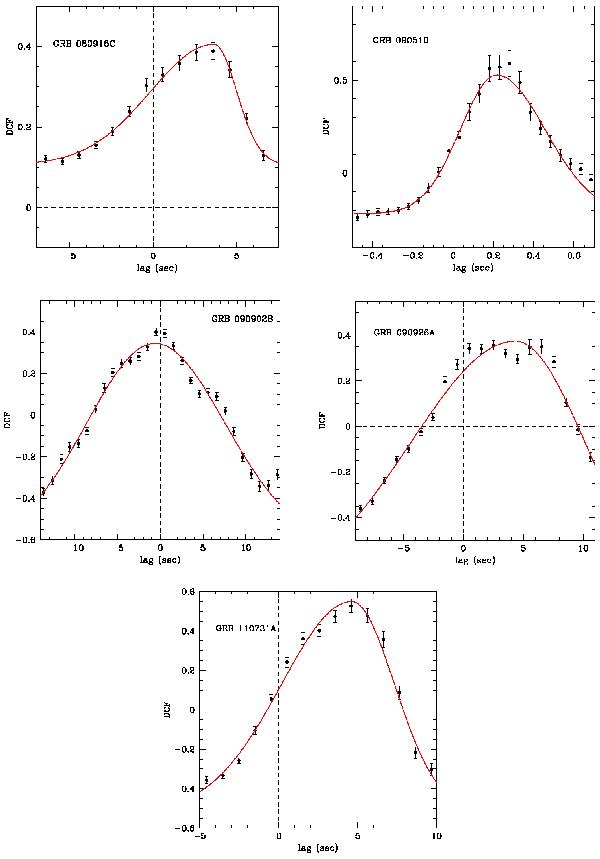
DCF curves, with individual 1-sigma uncertainties, between the LAT and GBM light curves of our 5 GRBs. Positive time lags suggest that the LAT is lagging the GBM signal. The solid red curve is the asymmetric Gaussian plus constant function that best fits the DCF peak.
This figure is made of several images, please see below:

Current usage metrics show cumulative count of Article Views (full-text article views including HTML views, PDF and ePub downloads, according to the available data) and Abstracts Views on Vision4Press platform.
Data correspond to usage on the plateform after 2015. The current usage metrics is available 48-96 hours after online publication and is updated daily on week days.
Initial download of the metrics may take a while.