Fig. 4
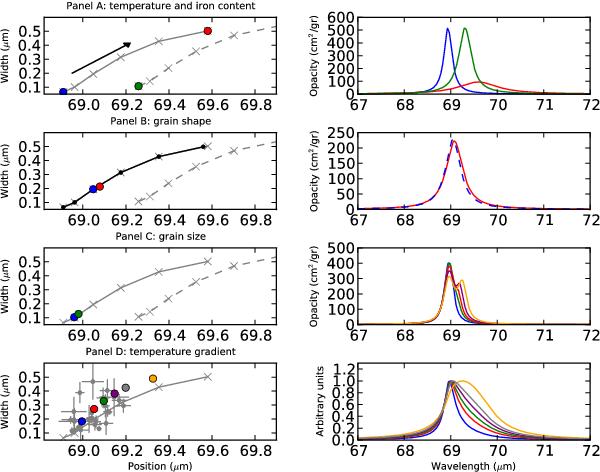
Influences of different parameters on the width and position of the 69 μm band as described in Sect. 5. In the left column the (Lorentzian) width is plotted against the wavelength position of the 69 μm band. In the right column examples of the absorption opacities for the 69 μm band are shown. The colours of the bands on the right correspond to the coloured dots in the figures on the left. The solid and dashed grey curves in panel A) are as in Fig. 3.The black arrow in panel A) indicates the direction of the increasing temperature of the laboratory measurements (from 50 to 295 K). Panel B) shows in solid black the width and position of the 69 μm band of crystalline olivine with 0% iron and calculated with DHS. The blue dashed band corresponds to DHS and the red one to CDE. Panel C) shows the position and width of the 69 μm band for different grain sizes (at T = 100 K). The 69 μm bands are plotted for the grain sizes 1 (blue), 4 (green), 5 (red), 6 (purple), and 7 μm (orange). Panel D) shows the width and position of a 69 μm band coming from a spherically symmetric distribution of crystalline olivine. The dots and bands with the colours blue, red, green, purple, orange, and grey have an (iρ, iT) of (2.0, 0.5), (2.0, 1.0), (2.0, 2.0), (3.0, 0.5), (4.0, 0.5), and (4.0, 2.0), respectively (see Sect. 5). The observed 69 μm bands are also shown in grey with error bars. The 69 μm bands coming from a temperature gradient shown in panel D) vary strongly in peak strength. To clearly show the broadening of these bands we normalized the bands to one.
Current usage metrics show cumulative count of Article Views (full-text article views including HTML views, PDF and ePub downloads, according to the available data) and Abstracts Views on Vision4Press platform.
Data correspond to usage on the plateform after 2015. The current usage metrics is available 48-96 hours after online publication and is updated daily on week days.
Initial download of the metrics may take a while.