Fig. 3
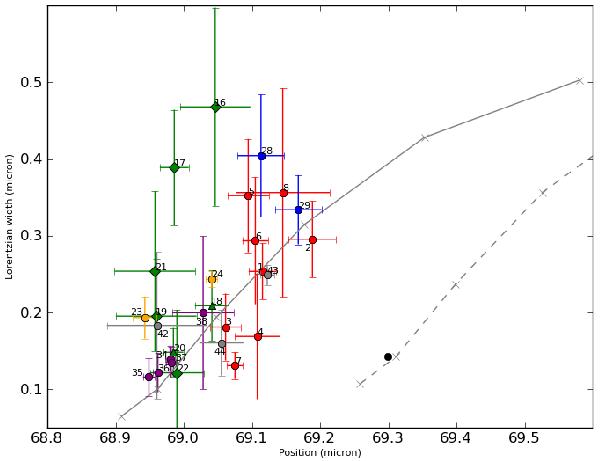
Position and width of all detected 69 μm bands. In red are the OH/IR stars, in green the post-AGB stars, in blue the post-AGB stars with circumbinary disks, in yellow two other likely disk sources, in purple the PNs, and in grey the massive evolved stars. In contrast to the 69 μm bands of the evolved stars, the position and width of the 69 μm band of the disk around the young main-sequence star β Pictoris is shown in black. In solid and dashed grey are the width and position of 69 μm bands using the laboratory measurements of Koike et al. (2003) and Suto et al. (2006). The solid grey is for crystalline olivine without iron and the dashed grey with 1% iron. The crosses on the curves indicate the temperatures going from 50, 100, 150, 200, and 295 K with increasing wavelength. The dashed grey curve is created using the extrapolation of de Vries et al. (2012).
Current usage metrics show cumulative count of Article Views (full-text article views including HTML views, PDF and ePub downloads, according to the available data) and Abstracts Views on Vision4Press platform.
Data correspond to usage on the plateform after 2015. The current usage metrics is available 48-96 hours after online publication and is updated daily on week days.
Initial download of the metrics may take a while.