Fig. 9
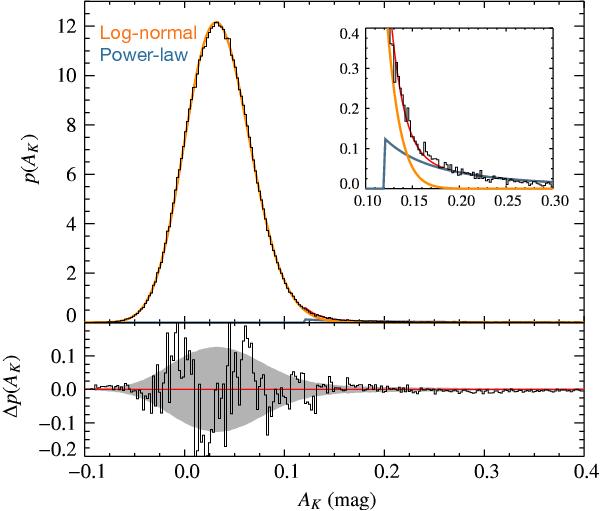
Column-density PDF two-component fit of Corona: the orange and blue curves correspond to a log-normal and a power-law fit to the observed PDF. The solid red curve represents the sum of the orange and blue curves (below ~0.12 mag, the red curve coincides with the orange curve). The fit of these two functions to the entire cloud produced better residuals (grey area) than for the case of a single log-normal, but a clear pattern in the residuals at lower column densities is still present.
Current usage metrics show cumulative count of Article Views (full-text article views including HTML views, PDF and ePub downloads, according to the available data) and Abstracts Views on Vision4Press platform.
Data correspond to usage on the plateform after 2015. The current usage metrics is available 48-96 hours after online publication and is updated daily on week days.
Initial download of the metrics may take a while.