Fig. 8
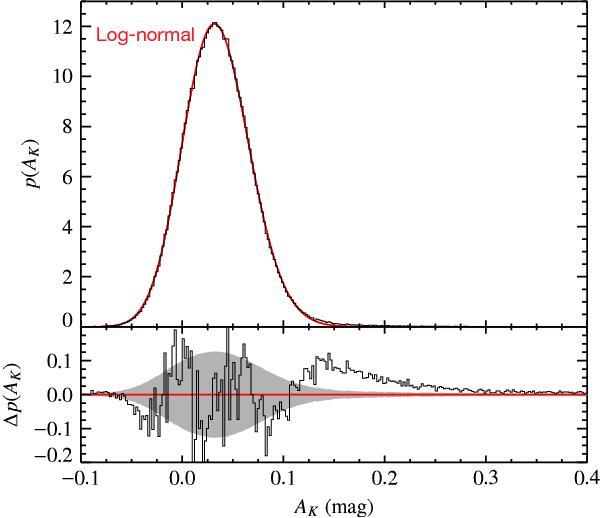
PDF of column density for the Corona Australis cloud. The solid red curve represents the best-fit of a single log-normal distribution to the data. The residuals of the fit are presented in the lower panel. The grey area in the residual plot delimits what would be expected from poisson noise. Note that the residuals are not poissonian but exhibit a clear pattern. The excess over the log-normal fit on the high extinction tail is present in a similar manner to the results for the clouds in Papers III and IV, and the results of Kainulainen et al. (2009) and Froebrich & Rowles (2010).
Current usage metrics show cumulative count of Article Views (full-text article views including HTML views, PDF and ePub downloads, according to the available data) and Abstracts Views on Vision4Press platform.
Data correspond to usage on the plateform after 2015. The current usage metrics is available 48-96 hours after online publication and is updated daily on week days.
Initial download of the metrics may take a while.