Fig. 3
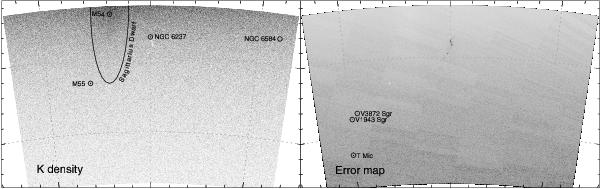
Left: K-band stellar density of the entire field studied (same scale as in Fig. 2). Clusters in this image appear as point sources and are labeled. The half ellipse marks an extended stellar overdensity corresponding to the Sagittarius Dwarf galaxy. Right: error map of the Nicer extinction map. The average error in the map is AK ~ 0.02 mag. The marked error peaks are caused by very bright, saturated, red giants that create a no-data region. The maximum error towards the densest regions of the cloud is AK ~ 0.06 mag.
Current usage metrics show cumulative count of Article Views (full-text article views including HTML views, PDF and ePub downloads, according to the available data) and Abstracts Views on Vision4Press platform.
Data correspond to usage on the plateform after 2015. The current usage metrics is available 48-96 hours after online publication and is updated daily on week days.
Initial download of the metrics may take a while.