Fig. 11
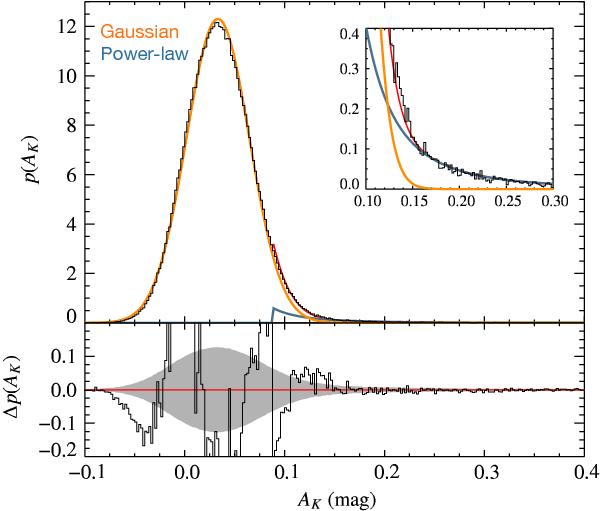
Column-density PDF two-component fit of Corona: the orange and blue curves corresponds to a Gaussian and a power-law simultaneous fits. The solid red curve represents the sum of the orange and blue curves (below ~0.09 mag, the red curve coincides with the orange curve). The fit of these two functions to the entire cloud produced the lowest χ2, although presenting residuals exhibiting a systematic correlated pattern at the low-end of the distribution.
Current usage metrics show cumulative count of Article Views (full-text article views including HTML views, PDF and ePub downloads, according to the available data) and Abstracts Views on Vision4Press platform.
Data correspond to usage on the plateform after 2015. The current usage metrics is available 48-96 hours after online publication and is updated daily on week days.
Initial download of the metrics may take a while.