Fig. 1
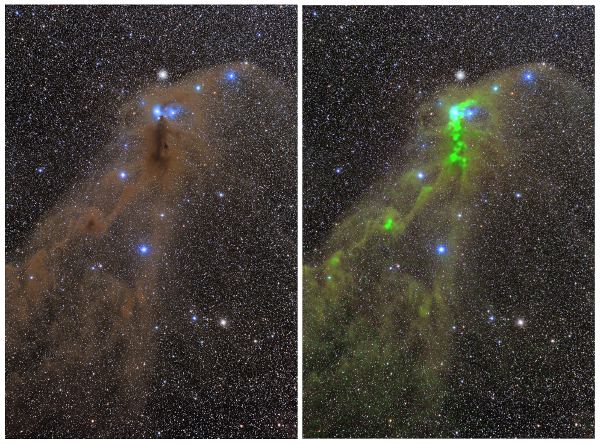
Optical image of the Corona Australis complex. The image covers approximately 3 by 5 deg2 and covers the Western-end of the cloud, the densest region of the cloud where star formation is ongoing. By clicking the “toggle image” box below while using Acrobat Reader, the extinction map presented in this paper appears in green. Image courtesy of Pavel Pech. Toggle image (online only - see PDF file)
Current usage metrics show cumulative count of Article Views (full-text article views including HTML views, PDF and ePub downloads, according to the available data) and Abstracts Views on Vision4Press platform.
Data correspond to usage on the plateform after 2015. The current usage metrics is available 48-96 hours after online publication and is updated daily on week days.
Initial download of the metrics may take a while.