Fig. 6

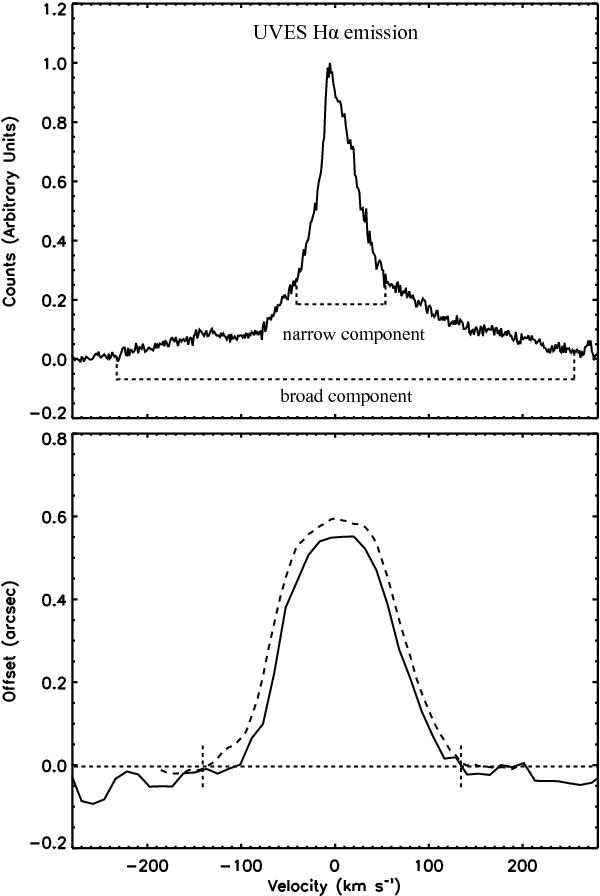
Spectro-astrometry of the ESO-Hα 574 Hα emission in the UVES spectrum. Upper panel: UVES Hα line profile is shown and the narrow and broad components of the line are marked. Lower panel: Spectro-astrometric results are shown and the solid line is the analysis before continuum subtraction and the dashed line after continuum subtraction. The 1σ error is ~20 mas. The Hα line is offset in the outflow between ±140 km s-1 and at least some of the broad component is found to be coincident with the stellar position.
Current usage metrics show cumulative count of Article Views (full-text article views including HTML views, PDF and ePub downloads, according to the available data) and Abstracts Views on Vision4Press platform.
Data correspond to usage on the plateform after 2015. The current usage metrics is available 48-96 hours after online publication and is updated daily on week days.
Initial download of the metrics may take a while.


