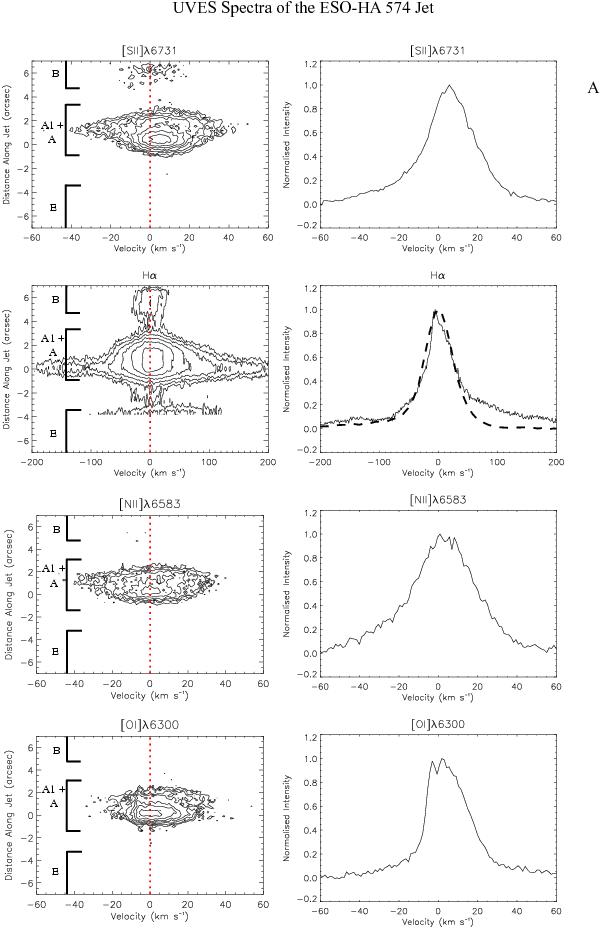
Fig. 4

Position velocity diagrams and line profiles of various lines in the ESO-Hα 574 jet made from UVES spectra taken in 2006. All velocities are systemic. Knots A1, A, and some of knots B and E are included in the data. Knots A1 and A are not resolved. Note that due to a difference of ~3.3 yrs between this data and the X-Shooter data the knots here are closer to the source positions than in Fig. 2. Using the tangential velocities given in Table 1, we calculate that knots A, B, and E will have shifted by 0.̋6, 0.̋95, and 1.̋4, respectively. The [S II]λ6731 and [N II]λ6583 lines regions have a blue-shifted wing which increases in velocity with distance from the source. In contrast to the Hα line region in the X-Shooter spectra the Hα line here has a more pronounced red-wing. For comparison the X-Shooter Hα line is over-plotted on the UVES profile as a dashed line. The [O I]λ6300 line region is slightly distorted from the subtraction of the [O I] sky line.
Current usage metrics show cumulative count of Article Views (full-text article views including HTML views, PDF and ePub downloads, according to the available data) and Abstracts Views on Vision4Press platform.
Data correspond to usage on the plateform after 2015. The current usage metrics is available 48-96 hours after online publication and is updated daily on week days.
Initial download of the metrics may take a while.


