Fig. 8
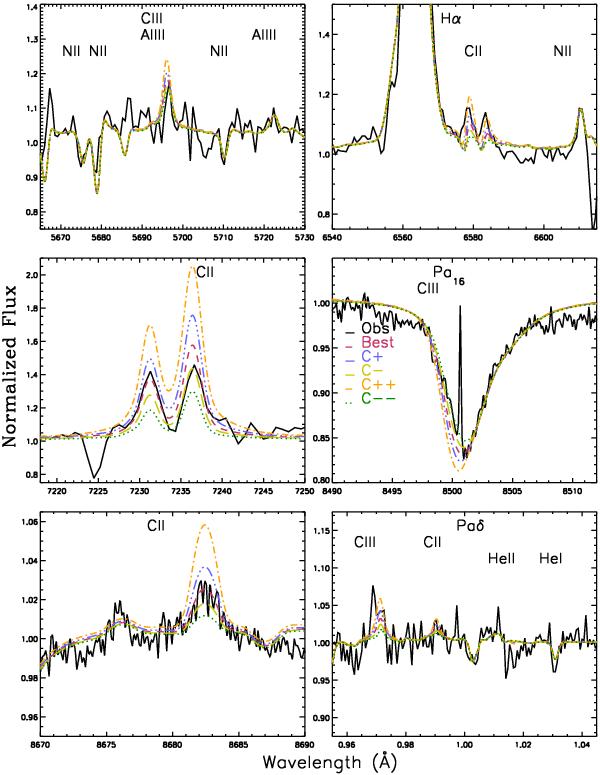
Determination of the carbon abundance for Wd1-5. The best-fit synthetic spectrum is given in red, with spectra utilising the upper and lower error-bounds given in Table 1 presented in blue and green respectively. Additionally, we provide spectra produced using more extreme, observationally unsupported upper and lower error-bounds (± 0.35 dex; orange and dark green respectively).
Current usage metrics show cumulative count of Article Views (full-text article views including HTML views, PDF and ePub downloads, according to the available data) and Abstracts Views on Vision4Press platform.
Data correspond to usage on the plateform after 2015. The current usage metrics is available 48-96 hours after online publication and is updated daily on week days.
Initial download of the metrics may take a while.