Fig. 9
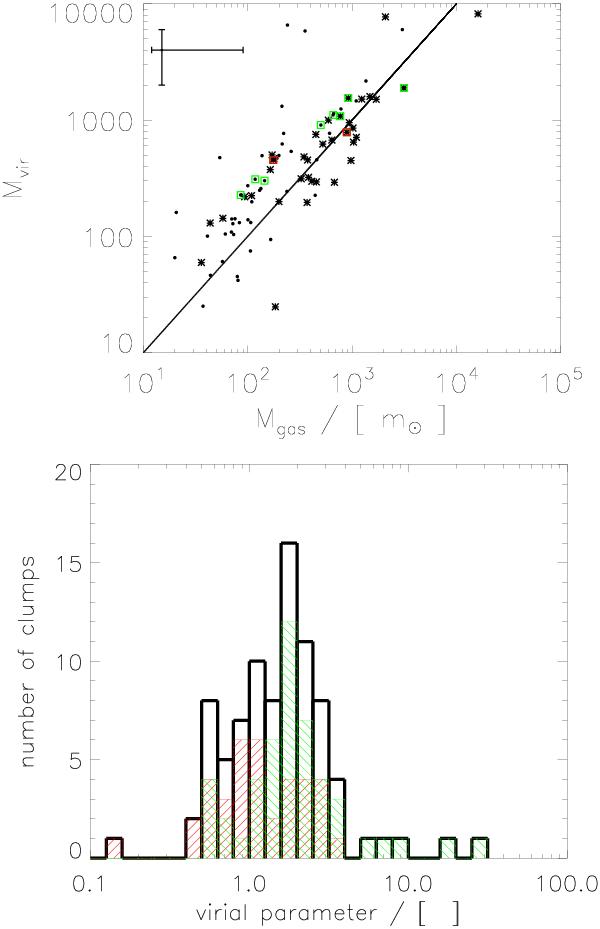
Top panel: virial mass derived from the N2H+ linewidth over the gas mass. The virial mass assumes a geometrical parameter of k = 158, which is intermediate between k = 126 for 1/ρ2 and k = 190 for 1/ρ. While the black dots indicate clumps without a PACS point source inside, the asterisks represent clumps with a PACS point source. Marked by green and red squares are the clumps of G28.34, with green boxes representing clumps in global infall, and red boxes representing clumps with signatures of outward moving gas (for details see Tackenberg et al. 2014). The solid line indicates unity. Lower panel: histogram of the virial parameter α. While the black histogram represents the full sample, the red and green histogram is the subset of clumps with and without a PACS point source, respectively.
Current usage metrics show cumulative count of Article Views (full-text article views including HTML views, PDF and ePub downloads, according to the available data) and Abstracts Views on Vision4Press platform.
Data correspond to usage on the plateform after 2015. The current usage metrics is available 48-96 hours after online publication and is updated daily on week days.
Initial download of the metrics may take a while.