Fig. 6
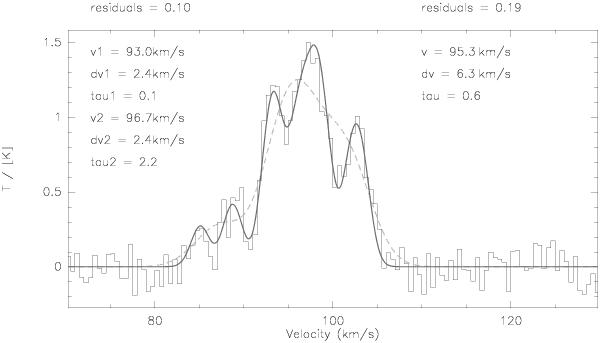
Spectra of IRDC 18454-4 Beuther & Sridharan (2007); Beuther et al. (2012). While the dashed line shows the single-component fit with the fitting parameters to the right, the solid line is the two-component fit with its fitting parameters to the left. The residuals are the results of the minimize task in CLASS.
Current usage metrics show cumulative count of Article Views (full-text article views including HTML views, PDF and ePub downloads, according to the available data) and Abstracts Views on Vision4Press platform.
Data correspond to usage on the plateform after 2015. The current usage metrics is available 48-96 hours after online publication and is updated daily on week days.
Initial download of the metrics may take a while.