Fig. 5
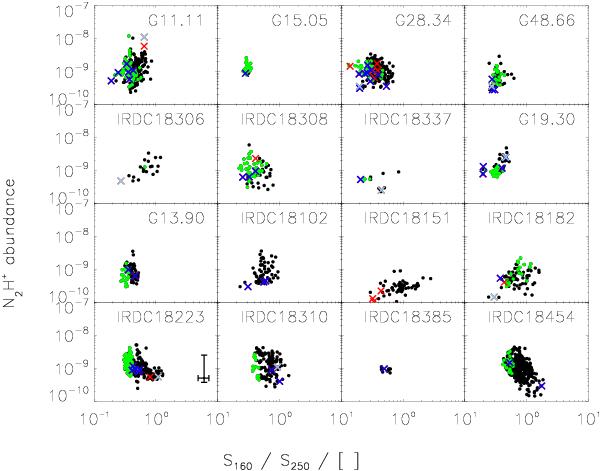
N2H+ abundance ratio over the color index between 160 μm and 250 μm. Marked by green dots are pixels that lie within IRDCs. Overplotted with red ×s are all mapped PACS sources. Blue crosses also have a 24 μm detection, while the light blue dots represent source that are saturated at 24 μm. The uncertainties given for IRDC 18223 are representative for all regions.
Current usage metrics show cumulative count of Article Views (full-text article views including HTML views, PDF and ePub downloads, according to the available data) and Abstracts Views on Vision4Press platform.
Data correspond to usage on the plateform after 2015. The current usage metrics is available 48-96 hours after online publication and is updated daily on week days.
Initial download of the metrics may take a while.