Fig. 3
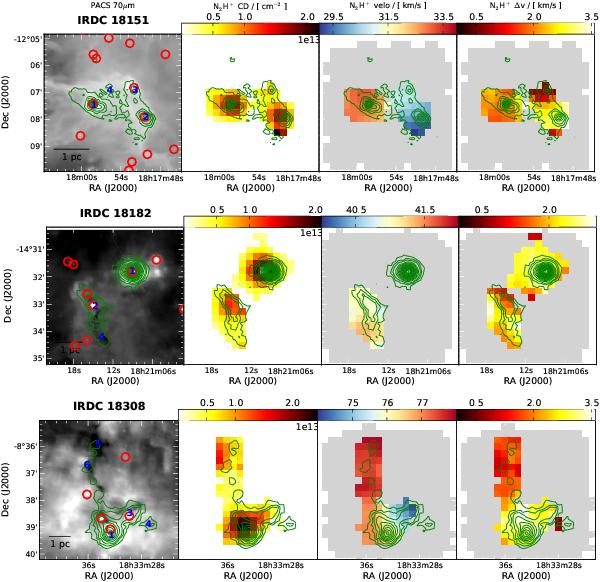
Parameter maps of the regions IRDC 18151, IRDC 18182, and IRDC 18308, each mapped with the MOPRA telescope. The left panels of each row are the PACS 70 μm maps with the PACS point sources detected by Ragan et al. (2012a) indicated by red circles, the blue numbers refer to the submm continuum peaks as given in Table 3. The second panels display the N2H+ column density derived from fitting the full N2H+ hyperfine structure. The third and fourth panels show the corresponding velocity and linewidth (FWHM) of each fit. The green contours are from ATLASGAL 870 μm at 0.31 Jy, 0.46 Jy, and 0.61 Jy, continuing in steps of 0.3 Jy. For IRDC 18151 the contours are MAMBO 1.2 mm observations, starting at 60 mJy in steps of 60 mJy. In all three maps the velocity resolution is smoothed to 0.4 km s-1.
Current usage metrics show cumulative count of Article Views (full-text article views including HTML views, PDF and ePub downloads, according to the available data) and Abstracts Views on Vision4Press platform.
Data correspond to usage on the plateform after 2015. The current usage metrics is available 48-96 hours after online publication and is updated daily on week days.
Initial download of the metrics may take a while.