Fig. 11
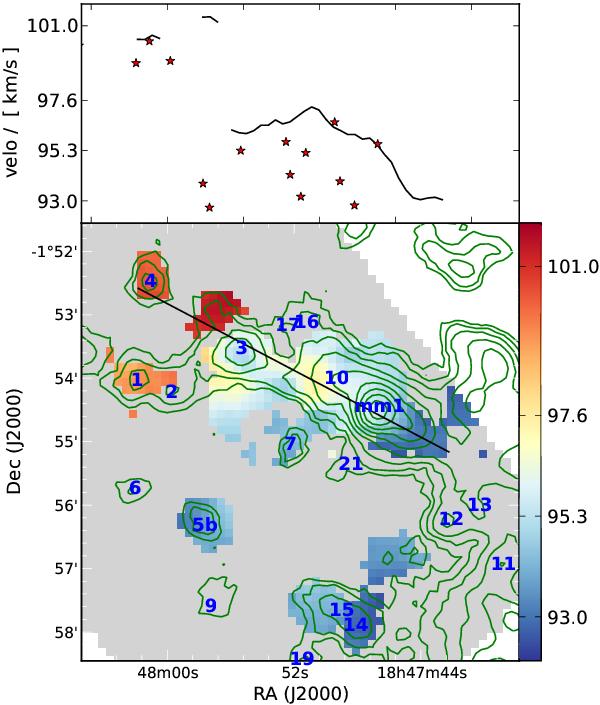
Profile of the N2H+ velocity of IRDC 18454. The left panel shows the velocity map with contours from ATLASGAL superimposed (see also Fig. 1). The top panel shows the velocity cut along the line marked on the velocity map. The stars mark the velocities of the clump peaks.
Current usage metrics show cumulative count of Article Views (full-text article views including HTML views, PDF and ePub downloads, according to the available data) and Abstracts Views on Vision4Press platform.
Data correspond to usage on the plateform after 2015. The current usage metrics is available 48-96 hours after online publication and is updated daily on week days.
Initial download of the metrics may take a while.