Fig. 1
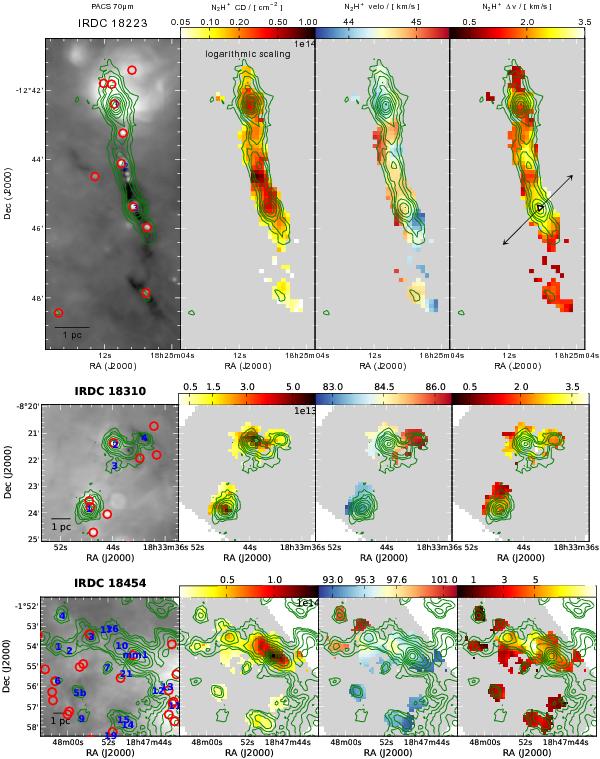
Parameter maps of the regions IRDC 18223, IRDC 18310, and IRDC 18454 mapped with the Nobeyama 45 m telescope, in top, middle, and bottom panel, respectively. The left panels of each row are the PACS 70 μm maps with the PACS point sources detected by Ragan et al. (2012a) indicated by red circles, the blue numbers refer to the submm continuum peaks as given in Table 3. The second panels display the N2H+ column density derived from fitting the full N2H+ hyperfine structure. The third and fourth panels show the corresponding velocity and linewidth (FWHM) of each fit. For IRDC 18223, and IRDC 18310 the contours from ATLASGAL 870 μm are plotted with the lowest level representing 0.31 Jy, and continue in steps of 0.3 Jy. The contour levels for IRDC 18454 are logarithmically spaced, with 10 levels between 0.31 Jy and 31 Jy. The column density scale of IRDC 18223 is logarithmic. The arrow in the fourth panel of IRDC 18223 is taken from Fig. 4 of Fallscheer et al. (2009), indicating the outflow direction.
Current usage metrics show cumulative count of Article Views (full-text article views including HTML views, PDF and ePub downloads, according to the available data) and Abstracts Views on Vision4Press platform.
Data correspond to usage on the plateform after 2015. The current usage metrics is available 48-96 hours after online publication and is updated daily on week days.
Initial download of the metrics may take a while.