Fig. 8
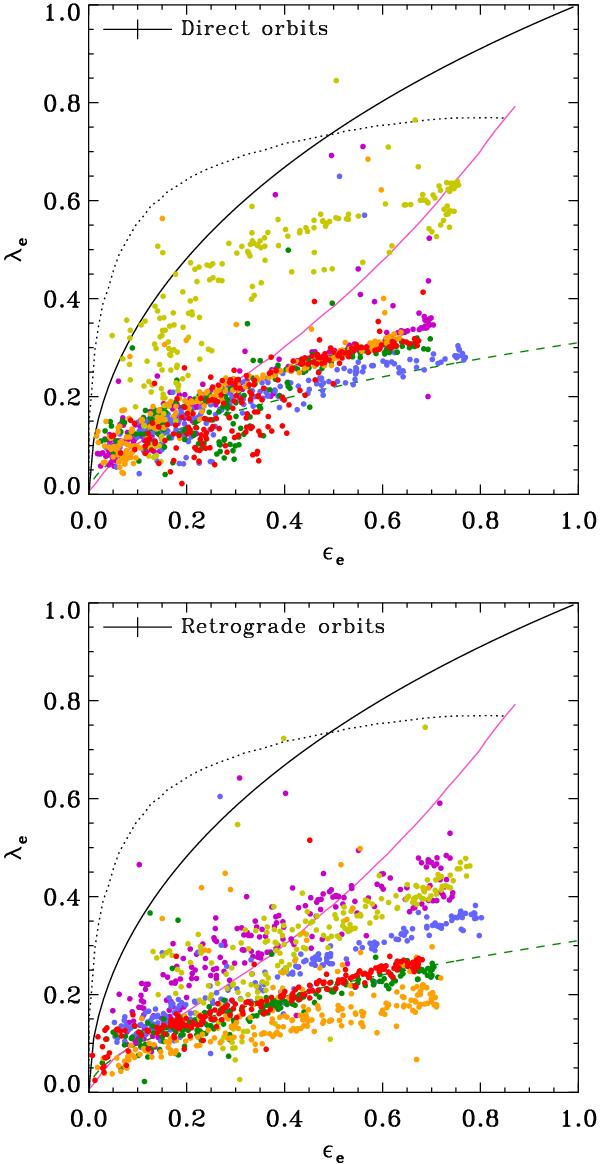
Dependence on the spin-orbit coupling of the location in the λe – ϵe diagram of the 200 random projections of our models. Prograde models are represented in the top panel, while retrograde ones are plotted in the bottom panel. The same color in each panel signifies the same set of initial parameters (α TF = 3.5 in all cases). The color-coding is the same as the one used in the left panels of Fig. 3 (consult the caption there). The legend for the lines is the same as in Fig. 2. The error bars in the left upper corner of each frame represent the typical errors in both axes. (This figure is available in color in electronic form.)
Current usage metrics show cumulative count of Article Views (full-text article views including HTML views, PDF and ePub downloads, according to the available data) and Abstracts Views on Vision4Press platform.
Data correspond to usage on the plateform after 2015. The current usage metrics is available 48-96 hours after online publication and is updated daily on week days.
Initial download of the metrics may take a while.