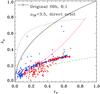
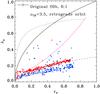
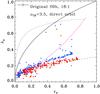
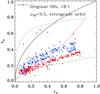
Fig. 7
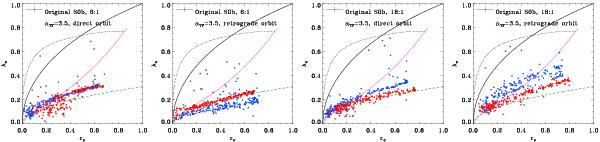
Dependence on the pericentre distance of the location in the λe – ϵe diagram of the 200 random projections of our models for an identical set of initial conditions (indicated at each frame). Red dots: model with dper = hD (short pericentre distance). Blue dots: model with dper = 8 hD (long pericentre distance). The legend for the lines is the same as in Fig. 2. The error bars on the left upper corner of each frame represent the typical errors in both axes. (This figure is available in color in electronic form.)
Current usage metrics show cumulative count of Article Views (full-text article views including HTML views, PDF and ePub downloads, according to the available data) and Abstracts Views on Vision4Press platform.
Data correspond to usage on the plateform after 2015. The current usage metrics is available 48-96 hours after online publication and is updated daily on week days.
Initial download of the metrics may take a while.